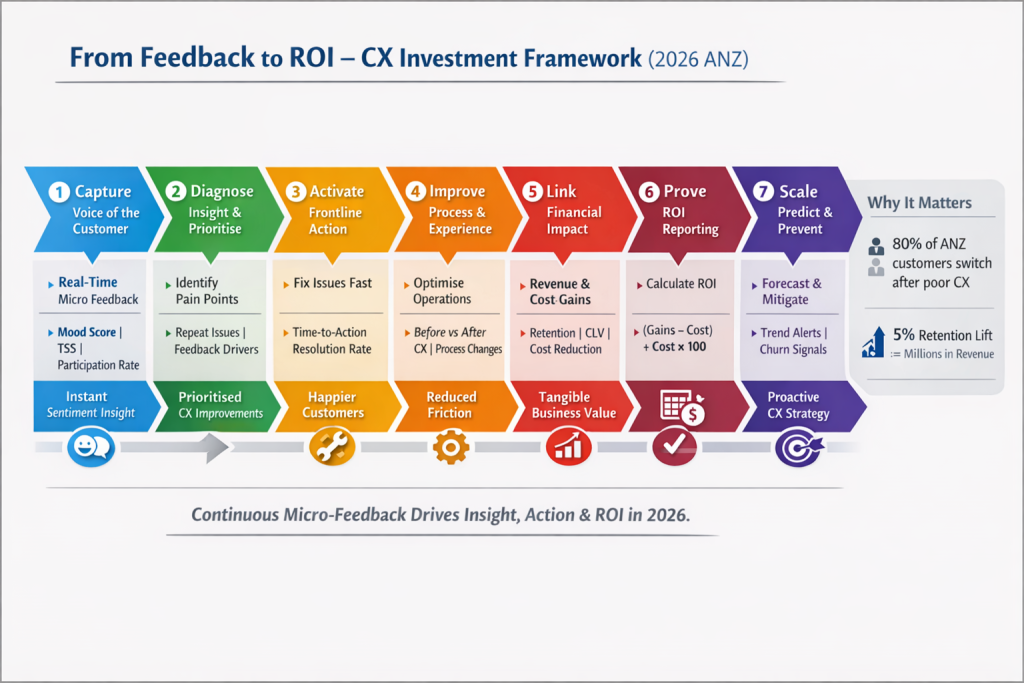
A Practical Measurement Model for 2026
This model shows how real-time customer feedback becomes financial return, even in a constrained economic environment.
1️⃣ Capture: Feedback at the Moment That Matters
Goal: Collect high-volume, low-friction insight at critical touchpoints.
What to Measure
- Customer Mood Score
- Touchpoint Satisfaction Score
- Negative Feedback Rate
- Participation Rate
Why This Matters in 2026
- Consumers are time-poor and cost-sensitive
- Long surveys = low response + delayed insight
- Real-time feedback captures emotion, not memory
Output: Live sentiment data by location, channel, time
2️⃣ Diagnose: Turn Signals Into Insight
Goal: Identify patterns, not just scores.
What to Analyse
- Top drivers of negative sentiment
- Repeat issues by location or shift
- Correlation between feedback and operational metrics
Example Diagnostic Views
- “Top 3 friction points per site”
- “Sentiment by wait time”
- “Negative spikes vs staffing levels”
Output: Prioritised CX issues with operational context
3️⃣ Activate: Frontline Action & Ownership
Goal: Fix issues where they happen.
What to Measure
- Time-to-Action (TTA)
- Issue Resolution Rate
- Frontline Engagement Rate
Why This Matters
- Fast action prevents escalation and churn
- Empowers frontline teams during labour shortages
- Reduces cost-to-serve
Output: Logged actions tied to specific feedback themes
4️⃣ Improve: Operational & Experience Change
Goal: Make permanent improvements, not temporary fixes.
What to Measure
- Repeat Issue Frequency
- Process Improvement Count
- CX Before vs After Scores
Examples
- Queue redesign → reduced wait dissatisfaction
- Staff training update → improved service sentiment
- Digital change → fewer complaints
Output: Evidence of sustained CX improvement
5️⃣ Link: CX to Financial Outcomes
Goal: Translate CX improvements into dollars.
Revenue Impact Metrics
- Increased visit frequency from satisfied customers
- Higher conversion or basket size
- Retained customers previously at risk
Cost Impact Metrics
- Reduction in complaints and escalations
- Lower rework and service recovery costs
- Fewer refunds or credits
Output: Quantified revenue protected or generated
6️⃣ Prove: ROI Calculation
Goal: Demonstrate commercial value clearly.
Example ROI Formula
ROI (%) =
(Financial Gains – Cost of CX Program) ÷ Cost of CX Program × 100
Example
- Revenue retained from churn reduction: $450,000
- Cost savings from fewer complaints: $120,000
- Total CX program cost: $150,000
ROI =
(($570,000 – $150,000) ÷ $150,000) × 100 = 280% ROI
7️⃣ Scale: Predict & Prevent
Goal: Move from reactive to predictive CX.
Advanced Metrics
- Sentiment Trend Velocity
- Early Churn Risk Signals
- Location Risk Heatmaps
Why This Matters in 2026
- Economic volatility requires early warning systems
- CX becomes a risk management function, not just marketing
Output: Predictive CX insights guiding investment decisions
The Full Model at a Glance
| Stage | Focus | Key Metrics | Outcome |
|---|---|---|---|
| Capture | Real-time feedback | Mood, TSS | Truth |
| Diagnose | Pattern detection | Drivers, trends | Insight |
| Activate | Frontline response | TTA, resolution | Action |
| Improve | Process change | Repeat issues | Improvement |
| Link | Financial impact | Revenue & cost | Value |
| Prove | ROI | ROI % | Credibility |
| Scale | Prediction | Risk signals | Resilience |
Executive Takeaway
In 2026, feedback is no longer a CX metric — it’s a financial input.
Organisations that:
- Capture feedback continuously
- Act on it quickly
- Measure outcomes commercially
will outperform those still relying on quarterly surveys and lagging indicators.