Ever wondered what your CX metrics should be and how to measure them? Worry no more here are my practical example CX metrics organisations in Australia & New Zealand can use in 2026 to support micro-feedback–driven CX initiatives.
These are designed to be simple, fast, frontline-friendly, and commercially meaningful. I have organized them into 6 categories as follows:
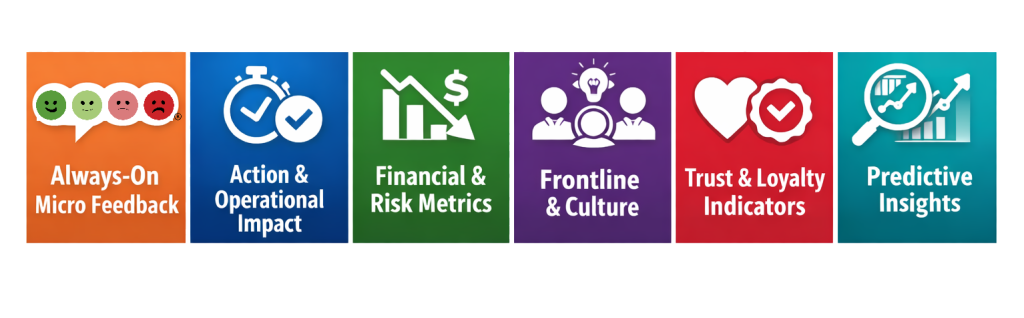
1. Core Micro Feedback Metrics (Always-On)
Customer Mood Score
- What it measures: Immediate emotional response at a touchpoint
- How: 4 point scale (e.g. very unhappy → very happy)
- Why it matters in 2026: Captures sentiment during cost pressure and service disruption moments
Example KPI:
Customer Mood Score = (Very Happy x100 + Happy x 66.66 + Unhappy x 33.3 + Very Unhappy x 0) / Total responses
Touchpoint Satisfaction Score (TSS)
- What it measures: Satisfaction with a specific interaction (checkout, delivery, appointment, support)
- Why: Identifies friction points faster than relationship surveys
Example KPI:
Avg TSS by location / channel / time of day
Negative Feedback Rate
- What it measures: Early warning indicator of CX risk
- Why: Rising negativity often precedes churn
Example KPI:
Negative Rate = (Unhappy responses ÷ Total responses) × 100
2. Operational CX Metrics (Linked to Action)
Time-to-Action (TTA)
- What it measures: Speed from feedback to frontline response
- Why: Customers expect action, not just listening
Example KPI:
Median time (minutes/hours) to respond to negative feedback
Issue Resolution Rate
- What it measures: % of flagged issues resolved
- Why: Proves feedback is operationally useful
Example KPI:
Resolved Issues ÷ Total Issues Raised
Repeat Issue Frequency
- What it measures: How often the same issue reoccurs
- Why: Indicates systemic problems vs one-off events
3. Financially Linked CX Metrics (Critical in 2026)
Revenue at Risk Indicator
- What it measures: Potential revenue exposure from negative sentiment
- How: Combine negative feedback with transaction value or visit frequency
Example KPI:
High-risk customers with 2+ negative interactions in 30 days
Cost-to-Serve Reduction
- What it measures: Impact of CX improvements on operational costs
- Why: Efficiency matters in a tight economic climate
Example KPI:
Reduction in complaints, rework, or escalations after CX fixes
4. Frontline & Employee Experience Metrics
CX Ownership Score
- What it measures: % of feedback reviewed or actioned by frontline teams
- Why: Encourages accountability and engagement
Employee-Driven Improvements
- What it measures: Number of improvements initiated by frontline insight
- Why: Ties CX to culture and retention
5. Trust & Loyalty Indicators
Feedback Participation Rate
- What it measures: Willingness of customers to share feedback
- Why: Declining participation often signals trust erosion
Visible Change Index
- What it measures: % of customers who report seeing improvements
- How: Occasional pulse question: “Did you notice improvements?”
6. Predictive & Forward-Looking Metrics
Sentiment Trend Velocity
- What it measures: Speed and direction of sentiment change
- Why: Identifies early risk or opportunity
Churn Risk Signal
- What it measures: Correlation between repeated negative feedback and attrition
- Why: Enables proactive retention actions
How Leading ANZ Organisations Use These Metrics in 2026
- Weekly frontline reviews, not quarterly reports
- Location-based benchmarking across AU & NZ
- CX tied to operational KPIs, not isolated dashboards
- Executive focus on trends, not averages
Key Takeaway
In 2026, the most effective CX metrics are:
- Simple
- Real-time
- Actionable
- Directly linked to revenue, cost, and trust